IC Markets Home Sign in Web Trader Contáctanos
IC Markets Social IC Markets Social

Información para
Operadores Serios

  • Acerca de IC Markets
  • ABRA UNA CUENTA BURSÁTIL
  • PRUEBE UNA DEMO GRATIS
  • Comienza a Operar
  • VISIT OUR BLOG
IC Markets Social
  • Acerca de IC Markets
  • ABRA UNA CUENTA BURSÁTIL
  • PRUEBE UNA DEMO GRATIS
  • Comienza a Operar
  • VISIT OUR BLOG
March 3, 2023Australian_Stocks_enIC Markets

Australia 200 Index – resistance line breached

Australia 200 Index has broken through the resistance line of a Triangle technical chart pattern. Because we have seen it retrace from this line in the past, one should wait for confirmation of the breakout before taking any action. It has touched this line twice in the last 16 days and suggests a possible target […]

Read more
March 2, 2023Australian_Stocks_enIC Markets

Hong Kong 50 Index – getting close to psychological price line

Hong Kong 50 Index is moving towards a resistance line. Because we have seen it retrace from this level in the past, we could see either a break through this line, or a rebound back to current levels. It has touched this line numerous times in the last 10 days and may test it again […]

Read more
March 1, 2023Australian_Stocks_enIC Markets

Australia 200 Index – getting close to psychological price line

Australia 200 Index is moving towards a support line. Because we have seen it retrace from this level in the past, we could see either a break through this line, or a rebound back to current levels. It has touched this line numerous times in the last 6 days and may test it again within […]

Read more
March 1, 2023Australian_Stocks_enIC Markets

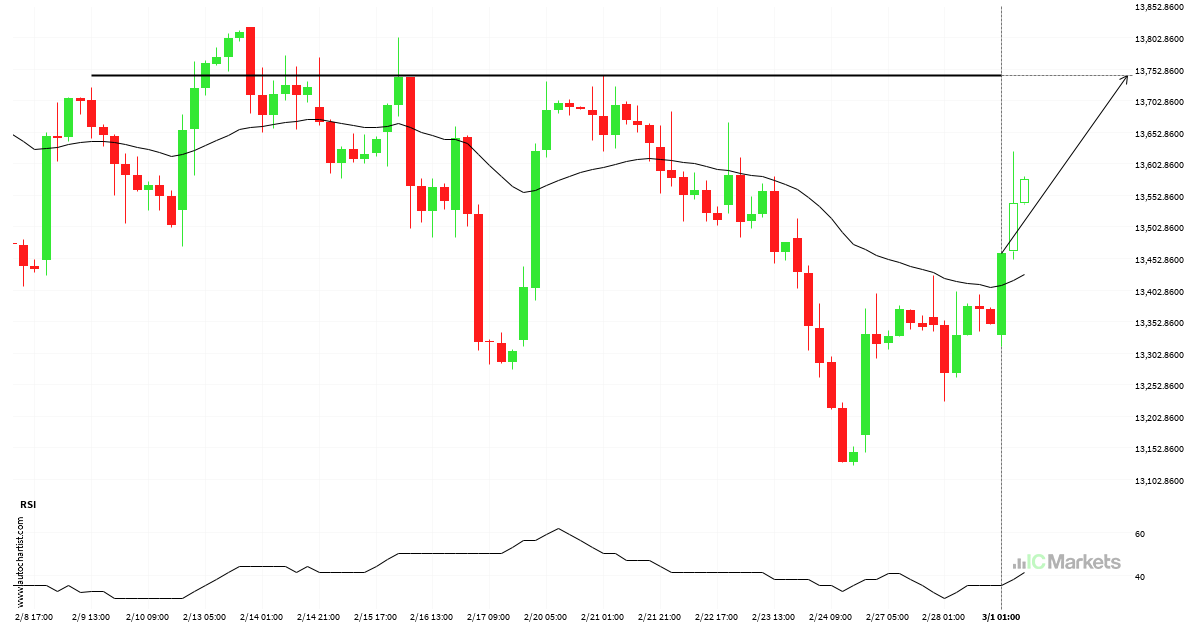
Breach of important price line imminent by FTSE China A50 Index

FTSE China A50 Index is moving towards a line of 13742.8604 which it has tested numerous times in the past. We have seen it retrace from this position in the past, so at this stage it isn’t clear whether it will breach this price or rebound as it did before. If FTSE China A50 Index […]

Read more
February 28, 2023Australian_Stocks_enIC Markets

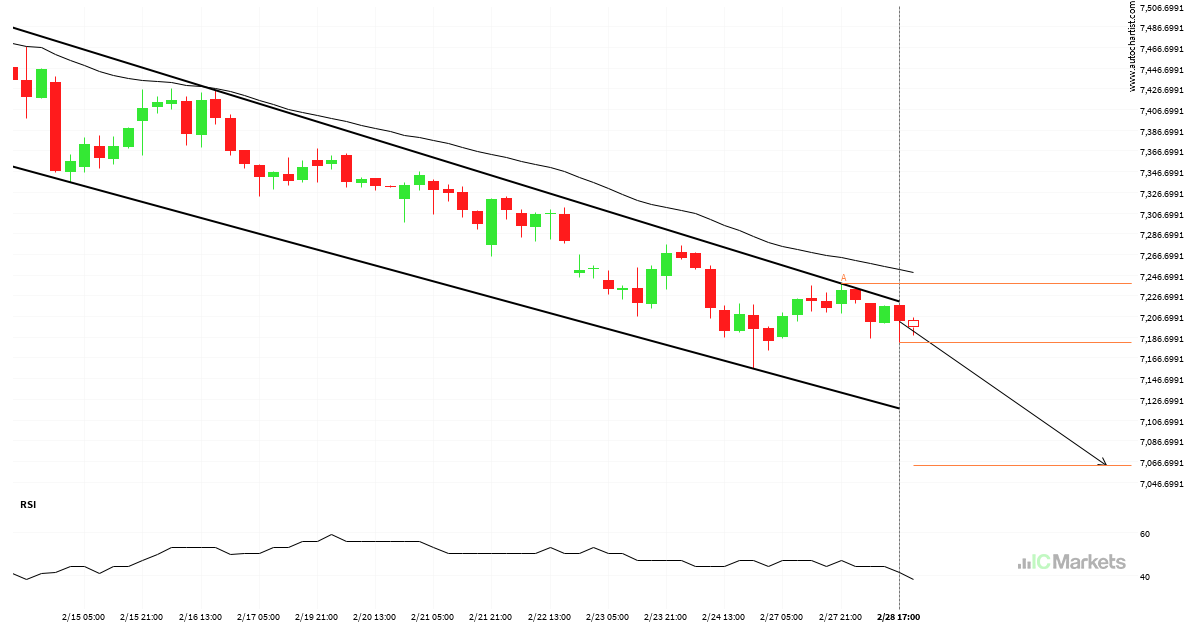
Will Australia 200 Index have enough momentum to break support?

Australia 200 Index is heading towards the support line of a Channel Down and could reach this point within the next 3 days. It has tested this line numerous times in the past, and this time could be no different from the past, ending in a rebound instead of a breakout. If the breakout doesn’t […]

Read more
February 28, 2023Australian_Stocks_enIC Markets

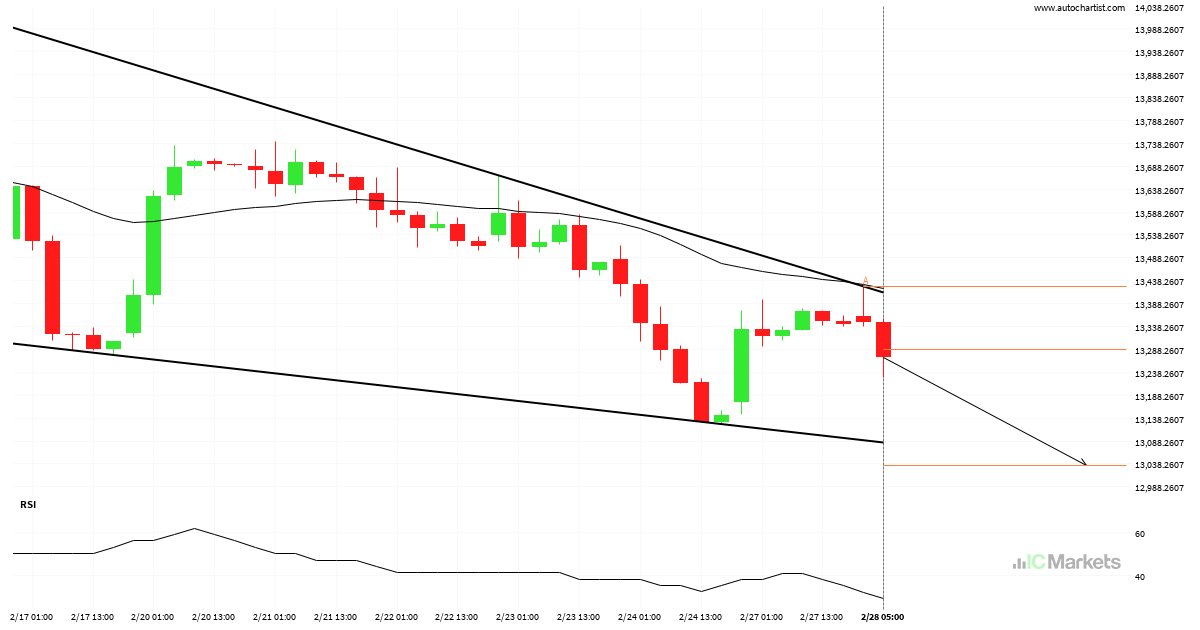
Possible breach of support level by FTSE China A50 Index

FTSE China A50 Index is moving towards a support line which it has tested numerous times in the past. We have seen it retrace from this line before, so at this stage it isn’t clear whether it will breach this line or rebound as it did before. If FTSE China A50 Index continues in its […]

Read more
February 27, 2023Australian_Stocks_enIC Markets

Possible breach of resistance level by FTSE China A50 Index

FTSE China A50 Index is moving towards a resistance line which it has tested numerous times in the past. We have seen it retrace from this line before, so at this stage it isn’t clear whether it will breach this line or rebound as it did before. If FTSE China A50 Index continues in its […]

Read more
February 23, 2023Australian_Stocks_enIC Markets

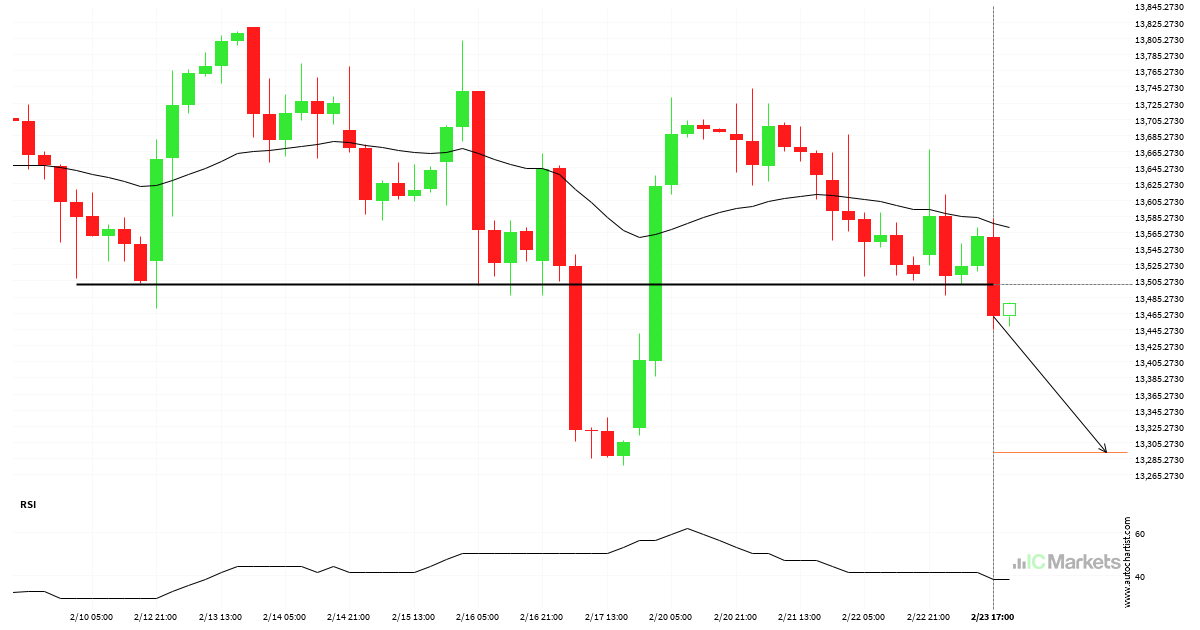
Big movement possible on FTSE China A50 Index

FTSE China A50 Index has broken through a line of 13500.8096 and suggests a possible movement to 13293.5566 within the next 3 days. It has tested this line numerous times in the past, so one should wait for a confirmation of this breakout before taking any action. If the breakout doesn’t confirm, we could see […]

Read more
February 21, 2023Australian_Stocks_enIC Markets

Hong Kong 50 Index approaching support of a Falling Wedge

Hong Kong 50 Index is approaching the support line of a Falling Wedge. It has touched this line numerous times in the last 12 days. If it tests this line again, it should do so in the next 2 days.

Read more
February 21, 2023Australian_Stocks_enIC Markets

Possibility of big movement expected on Australia 200 Index

Australia 200 Index has broken through a resistance line of a Falling Wedge and suggests a possible movement to 7373.5736 within the next 2 days. It has tested this line in the past, so one should probably wait for a confirmation of this breakout before taking action. If the breakout doesn’t confirm, we could see […]

Read more
  • 1
  • 2
  • 3
  • …
  • 45
  • 46
  • 47
  • 48
  • 49
  • 50
  • 51
  • …
  • 153
  • 154
  • 155

Recent Posts

  • US Wall Street 30 Index – المستوى الرئيسي – مقاومة
  • Brent Oil vs US Dollar – نموذج الرسم البياني – قناة صاعدة
  • Brent Oil vs US Dollar – نموذج الرسم البياني – قناة صاعدة
  • Hong Kong 50 Index – نموذج الرسم البياني – مثلث صاعد
  • Hong Kong 50 Index – รูปแบบกราฟ – สามเหลี่ยมขาขึ้น

Recent Comments

    Traducción


     Edit Translation

    Opere con un

    líder del mercado en el que puede confiar

    ABRA UNA CUENTA BURSÁTIL PRUEBE UNA DEMO GRATIS

    Trading en Forex

    • Qué es Raw Spread
    • Resumen de cuentas
    • Abre una Cuenta
    • Trader Launch en Web

    Especificaciones de Trading

    • Spreads y Comisiones
    • Rango de Mercados
    • Horas de Trading
    • Depósitos
    • Retiros

    Acerca de IC Markets

    • Help Center
    • Por qué con IC Markets
    • Regulación
    • Documentos Legales
    • Contáctanos


    Forex Trading

    • Accounts Overview
    • Open an Account
    • Launch Web Trader

    Trading Specifications

    • Spreads and Commissions
    • Range of Market
    • Trading Hours
    • Funding
    • Withdrawal

    About IC Markets

    • Chat with a Specialist 24/7
    • Why IC Markets
    • Regulation
    • Legal Documents
    • Contáctanos

    Descargo de responsabilidad: Estos documentos son material de marketing cuyo contenido es publicado solo con propósitos informativos. Este material no contiene y no debe ser considerado un consejo de inversión y recomendaciones, o sugerencias para llevar a cabo otras acciones con los instrumentos financieros. Los widgets integrados pertenecen a sus autores independientes externo, y IC Markets no es responsable de su contenido o cómo afectan en las operaciones.

    Derechos reservados de todo el contenido. Las opiniones de los autores tal vez no coincidan con la opinión de los editores del blog. Cuando copie material de este sitio o conecte RSS para volver a publicar nuestros artículos, es obligatorio el enlace a IC Markets o la atribución en el formato “Blog de IC Market”. Para dudas generales, por favor, póngase en contacto con la oficina editorial a través de la página “Contacto”.

    Advertencia de riesgo: Operar derivados conlleva un altor riesgo en su capital y solo debería operar con capital que puede permitirse perder. Las operaciones con derivados podrían no ser adecuadas para todos los inversores, por lo tanto, asegúrese de entender por completo los riesgos que conlleva y buscar asesoramiento independiente si fuera necesario. Una Declaración de Divulgación del Producto (PDS, por sus siglas en inglés) se tendrá en cuenta antes de participar en una transacción con nosotros.

    Los contenidos de esta página son solo información general y no tienen en cuenta su situación personal, objetivos financieros o necesidades. Depende de usted garantizar que los productos que ofrecemos se ajustas a sus necesidades específicas. No debería operar con nosotros a menos que entienda las características y riesgos de los productos que ofrecemos. Esto significa que tal vez necesite buscar asesoramiento independiente antes de empezar a operar con nosotros.

    © 2022 Raw Trading Ltd | All rights reserved.
    • Sample Page